

Of the 377 local areas in the UK, 324 (86 per cent) have seen a week-on-week rise in rates, 52 (14 per cent) have seen a fall and one is unchanged.
Here we reveal the infection rate of every local authority are in Yorkshire, ranked from highest to lowest.
Of the 17 local authority areas, 15 saw a rise in cases, while Craven and Calderdale were the only areas where cases fell.
The figures for the seven days to November 15 are based on tests carried out in laboratories (pillar one of the Government’s testing programme) and in the wider community (pillar two). The rate is expressed as the number of new cases per 100,000 people. Images are for illustrative purposes only.
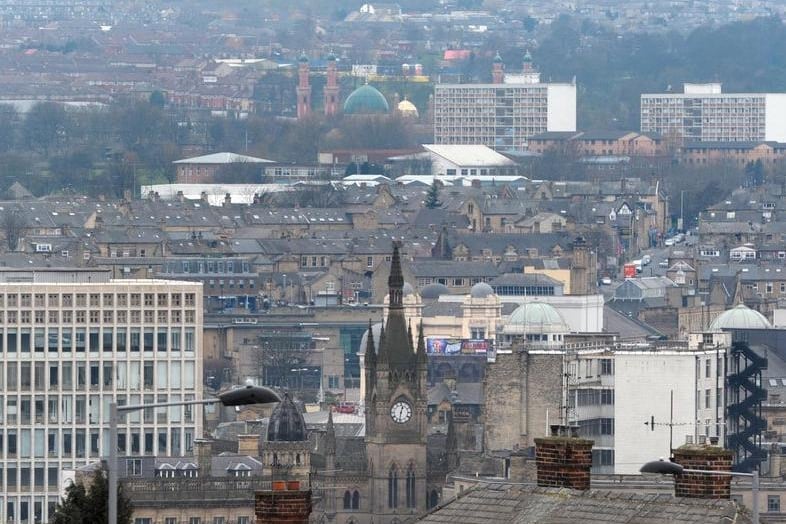
1. Bradford
Bradford had a rate of 142.5 (769 cases) in the seven days to March 21, down from 144.5 (780 cases) the previous week.
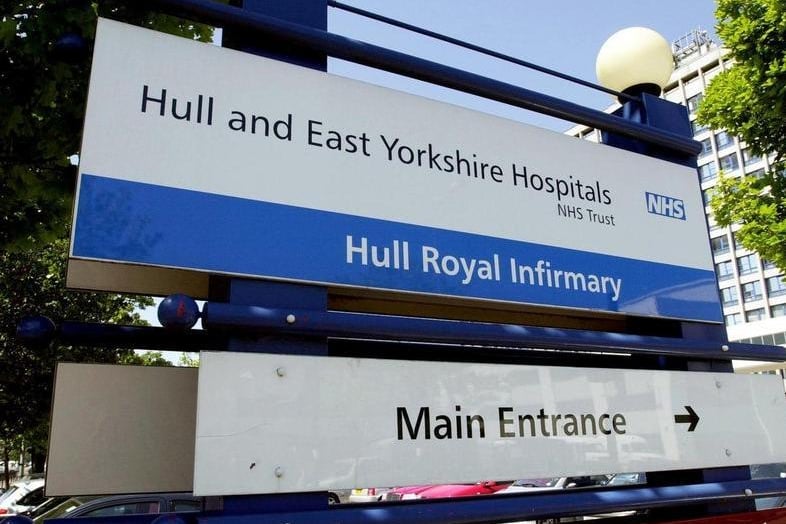
2. Hull
Hull had a rate of 151.3 (393 cases) in the seven days to March 21, down from 171.3 (445 cases) the previous week.
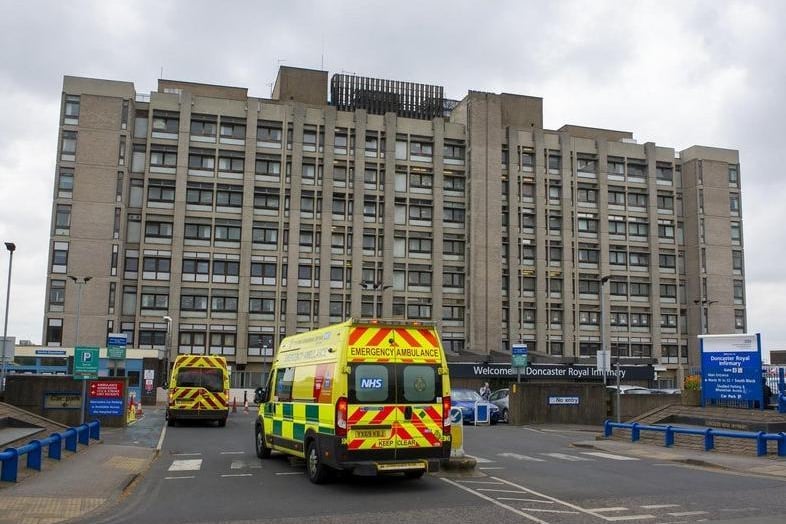
3. Doncaster
Doncaster had a rate of 142.7 (445 cases) in the seven days to March 21, up from 111.9 (349 cases) the previous week.
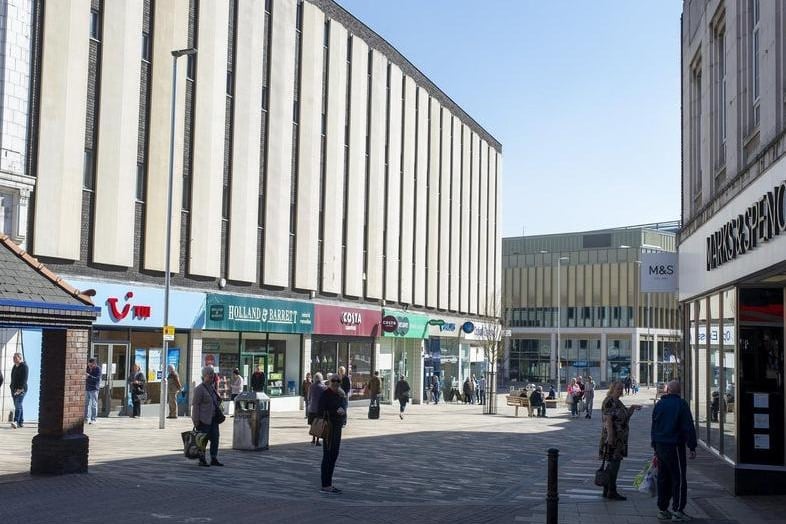
4. Barnsley
Barnsley had a rate of 185.1 (457 cases) in the seven days to March 21, up from 174.2 (430 cases) the previous week.
5. Rotherham
Rotherham had a rate of 140.9 (374 cases) in the seven days to March 21, up from 135.4 (362 cases) the previous week.
6. Wakefield
Wakefield had a rate of 135.5 (472 cases) in the seven days to March 21, up from 128.9 (449 cases) the previous week. (photo: SWNS)