
Official Government figures show that since mid-January the rate of positive Covid cases per 100,000 people in Leeds has been falling. It's now down to 99.9. But infection rates vary across the city's Middle Super Output Areas (MSOAs) - a geographic measure of around 8,000 people. These 19 areas have seen the number of new coronavirus cases more than double in the seven days to March 16, the latest available figures. All images are for illustrative purposes only.
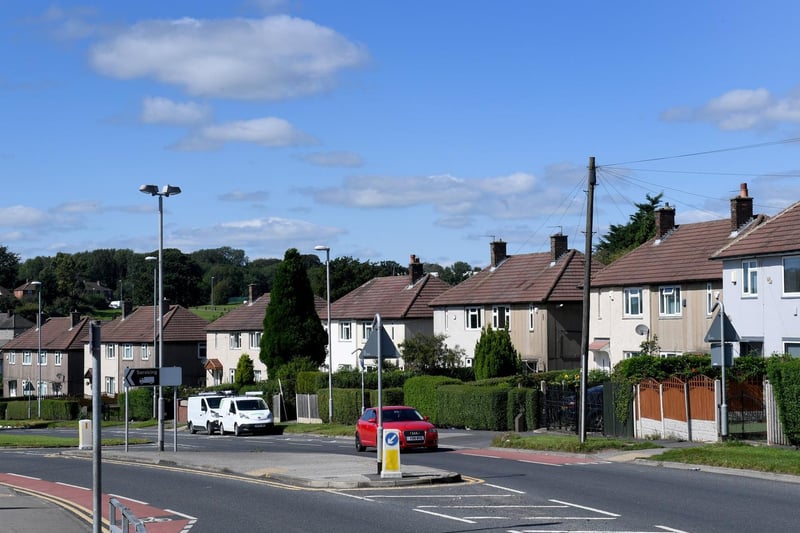
1. Seacroft South
Seacroft South recorded 14 new cases, that’s a rate of 251.9 per 100,000 people. It’s up 600% from the previous week.
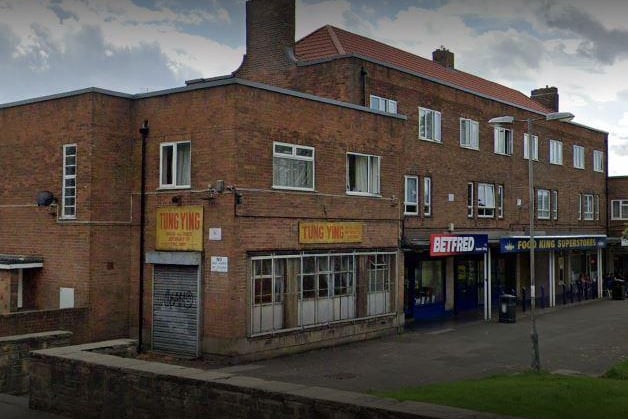
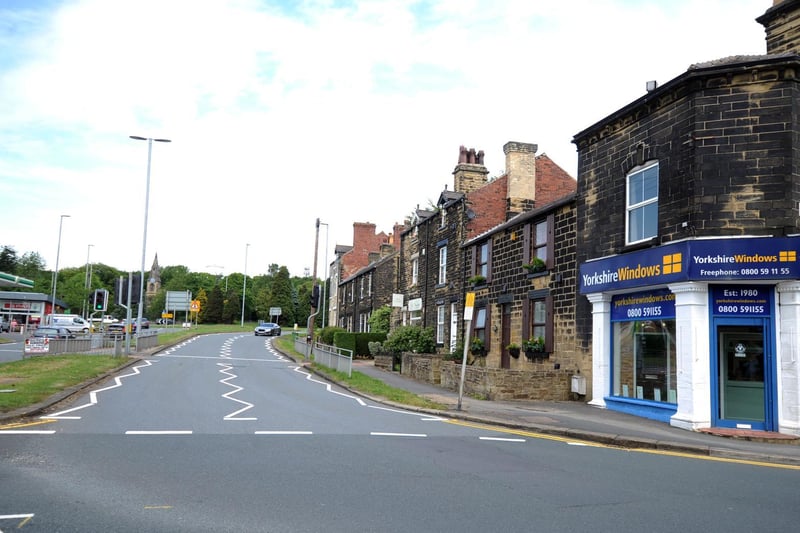
2. Swarcliffe
Swarcliffe recorded 14 new cases, that’s a rate of 198.5 per 100,000 people. It’s up 366.7% from the previous week. Photo: Google
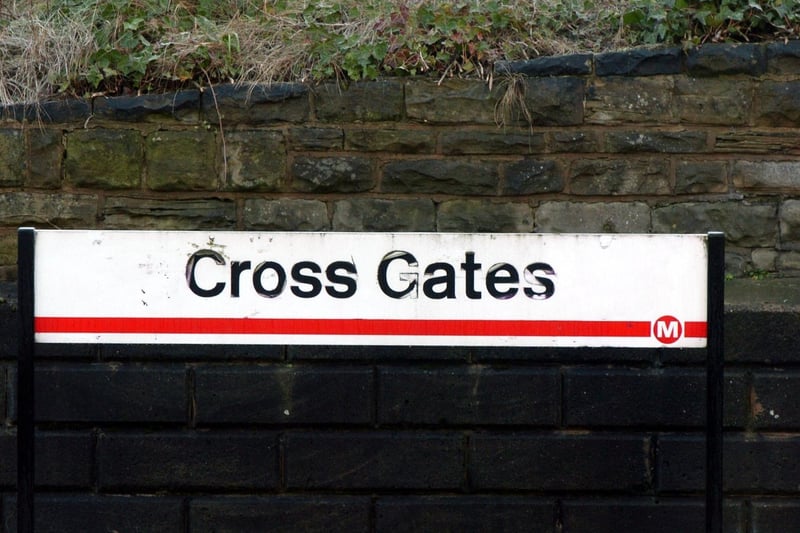
3. Cross Gates West & Killingbeck
Cross Gates West & Killingbeck recorded 12 new cases, that’s a rate of 189.1 per 100,000 people. It’s up 300% from the previous week.
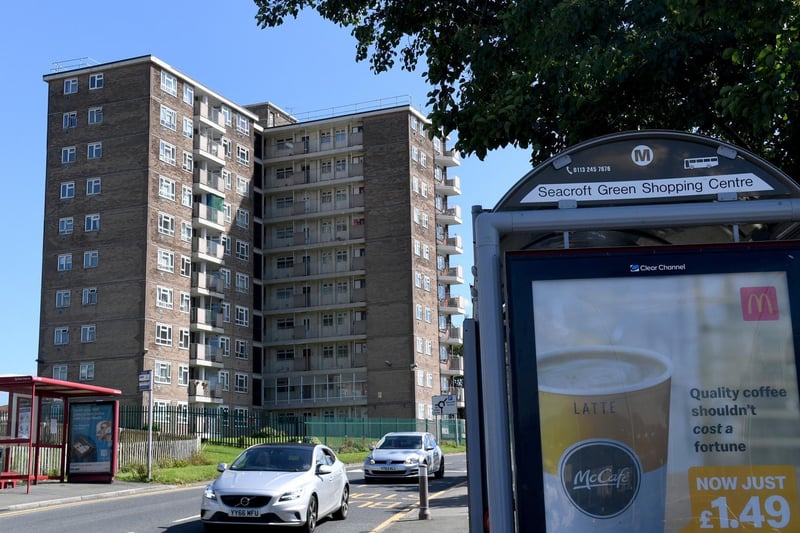
4. Seacroft North & Monkswood
Seacroft North & Monkswood recorded eight new cases, that’s a rate of 140.2 per 100,000 people. It’s up 300% from the previous week.
5. Moortown
Moortown recorded eight new cases, that’s a rate of 107.9 per 100,000 people. It’s up 300% from the previous week.
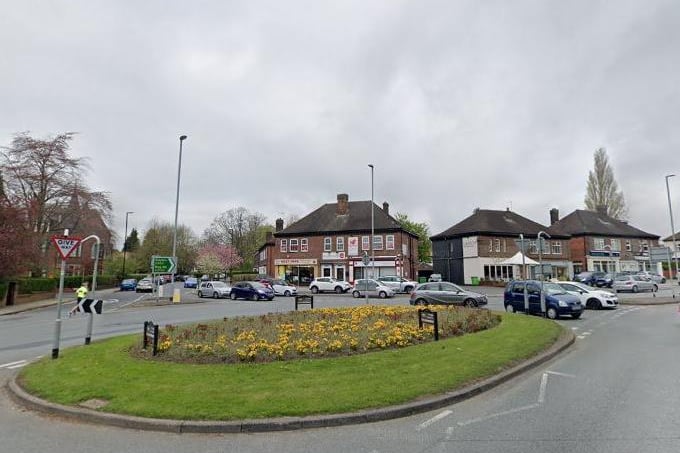
6. Far Headingley & Weetwood
Far Headingley & Weetwood recorded eight new cases, that’s a rate of 68.8 per 100,000 people. It’s up 300% from the previous week. Photo: Google